Exchange-traded funds (ETF) are investment funds whose securities are traded like shares on a stock exchange.
ETFs have changed considerably in the past few years. While index ETFs usually attempt to track a benchmark index, an ETF may not necessarily track the performance of a stock index: some ETFs may track the price of a commodity such as oil, gas, gold or grain, while others may track a bond, precious metal, commodity or other index. Yet other ETFs may track currencies, moving up and down with foreign exchange rates.
With these ETFs, the portfolio manager seeks to outperform a benchmark index. The fees for these ETFs may be higher than for ETFs that merely attempt to replicate an index.
Why read the ETF Fund Facts?
How to buy or sell ETF securities
You can buy or sell ETF securities through an on-line broker or a dealing representative (of an investment dealer). If you sell them, you will realize a capital gain or loss.
Expected return
In the form of:
- Dividends;
- Interest;
- Capital gain (loss) realized when you sell your securities.
Liquidity
ETF securities can be traded on an exchange. Generally, an ETF’s liquidity depends on market makersWith respect to trading securities, a market maker is a trader who maintains the liquidity of a security by buying and selling it..
Risk: low to high
In the case of an index ETF, the risk depends on such factors as the volatility of the index the ETF replicates. For example, an emerging market ETF could be riskier than an ETF that tracks the index of the largest companies listed on an exchange of an industrialized country.
Types of ETF
Index ETFs are meant to track a benchmark index such as a stock market indexA stock market index is a statistic that measures stock market developments. These indexes are frequently used as an indicator of economic conditions.. Contrary to what happens with an actively managed portfolio, the portfolio manager of an index ETF is generally not mandated to maximize the fund’s return, but only to follow the benchmark index. This passive management of index ETFs explains their typically lower management fees.
Inverse ETFs strive to deliver the opposite of the daily performance of the index they are tracking. A word of caution about inverse ETFs: the return generated by this type of ETF over a period longer than one day can differ significantly from the reverse direction of the fund’s benchmark index. This is illustrated in the table at the end of this document, which shows the fluctuations in this type of ETF.
Active ETFs do not seek to replicate an index. Instead, they aim to achieve a specific investment objective by investing in a portfolio of securities (e.g., stocks, bonds, commodities or cryptoassets). Active ETFs may have a higher rate of turnover than some index ETFs because the investments making up an active ETF’s portfolio are actively bought and sold by the portfolio manager. The tax implications of investing in an active fund may therefore be more significant than for an index ETF (portfolio turnover can give rise to capital gains). Active ETFs may also have higher management fees than index ETFs, reflecting the additional demands on the portfolio manager.
Leveraged ETFs are more appropriate for sophisticated investors. This category of ETF amplifies the movements of an index in both directions. Some leveraged ETFs aim to offer a multiple of the daily return of a benchmark index. For example, they may offer double or triple the daily return of an index. However, leveraged ETFs generally do not track the benchmark index for more than one day.
This table shows the fluctuations in returns for this type of ETF.
Example of a leveraged ETF
Day 1: DEF index posts 10.000 points
Jade invests $1.000 in a leveraged ETF that doubles the DEF index return.
Day 2: DEF index rises to 10,100 points (a gain of 1%)
Jade therefore makes 2% on her investment, or double the index’s daily return. Her investment is now worth $1,020.
Day 3: DEF index falls back to 10.000 points (a drop of 0.99% from the previous day)
As a result, Jade suffers a loss of 1.98%. Her investment is now worth $999.80. Although the benchmark index has simply returned to its starting point, Jade has lost $0.20. The more the index fluctuates, the greater the loss. Over the long term, the gap widens.
The following table shows what happens if Jade keeps her investment for a year and the index climbs 100 points on Day 1 and then loses 100 points the following day, and continues to swing back and forth in this way. Jade’s investment will only be worth about $965 after one year, even if the index does not shed any value.
Holding on to leveraged ETFs for a long time can therefore be very risky.
Leveraged inverse ETFs are better suited to sophisticated investors.
These funds seek to generate a multiple of the opposite of the return of the benchmark index each day.
Comparison of the value of different ETFs based on fluctuations in the benchmark index*
| Days | Benchmark index | ETF tracking the benchmark index | Inverse ETF | Leveraged ETF at 200% | Leveraged inverse ETF at 200% |
|---|---|---|---|---|---|
Day 1 | $10000 (purchase ETF) | $1,000.00 | $1,000.00 | $1,000.00 | $1,000.00 |
Day 2 | 10100 (down 100 points) | $1,010.00 | $990.00 | $1,020.00 | $980.00 |
Day 3 | 10000 (baisse de 100 points) | $1,000.00 | $999.80 | $999.80 | $999.41 |
Day 4 | 10100 (down 100 points) | $1,010.00 | $989.80 | $1,019.80 | $979.42 |
Day 5 | 10000 (baisse de 100 points) | $1,000.00 | $999.60 | $999.60 | $998.81 |
Day 6 | 10100 (down 100 points) | $1,010.00 | $989.61 | $1,019.60 | $978.84 |
Day 7 | 10000 (baisse de 100 points) | $1,000.00 | $999.41 | $999.41 | $998.22 |
Day 8 | 10100 (down 100 points) | $1,010.00 | $989.41 | $1,019.39 | $978.25 |
Day 9 | 10000 (baisse de 100 points) | $1,000.00 | $999.21 | $999.21 | $997.63 |
Day 10 | 10100 (down 100 points) | $1,010.00 | $989.22 | $1,019.19 | $977.67 |
Day 365 | $10 000 | $1,000.00 | $964.60 | $964.60 | $897.49 |
*Assumptions: No dividends or other income is paid. For simplification purposes, fees and charges are not included. Example for illustration purposes.
Did you know?
Often, you see the words "CAD-Hedged". This means that the portfolio manager is trying to hedge exposure to foreign currencies.
This coverage is not free. Depending on your investment strategy or your currency expectations, you will choose a "CAD hedged" fund or not.
End of the insightExchange-Traded Funds (ETFs) Facts
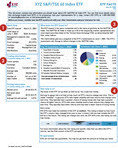
Here is an example of a Funds Facts that will be given to you or will be available on the institution's website.
For more detailed information on the different sections, view the Exchange-Traded Funds (ETFs) Facts sample.